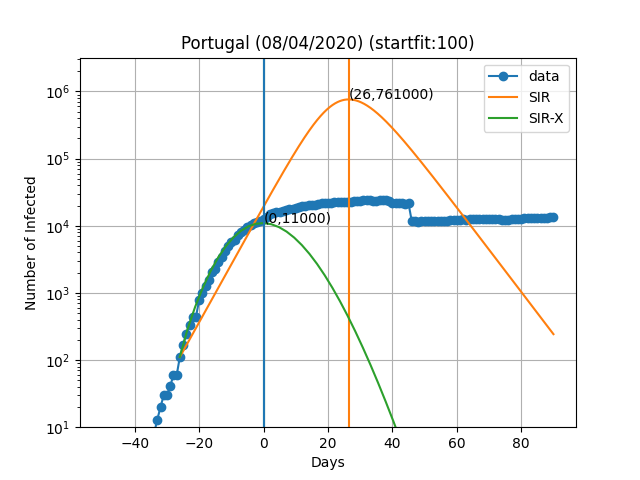
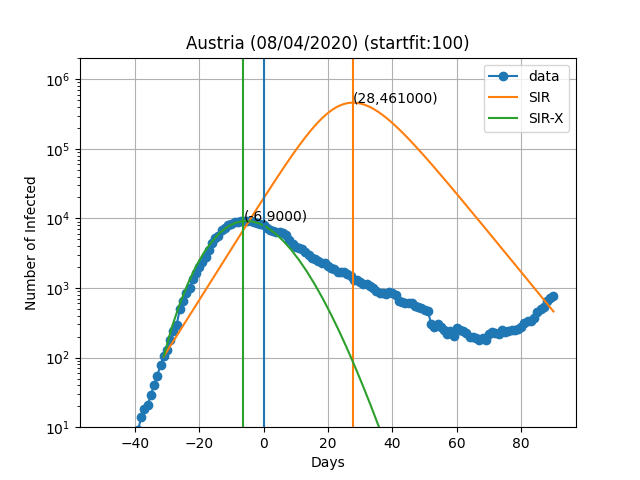
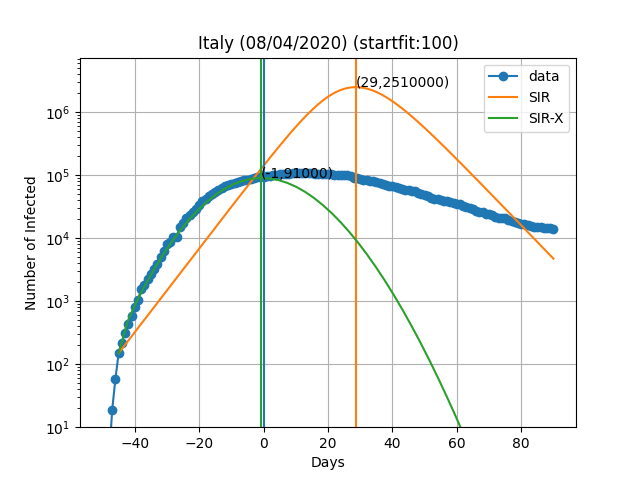
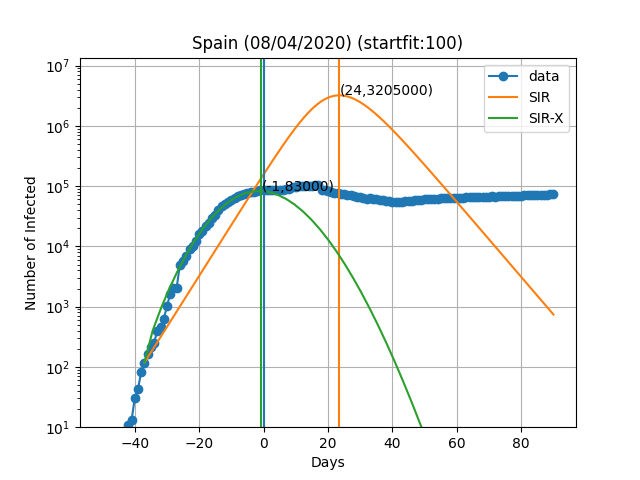
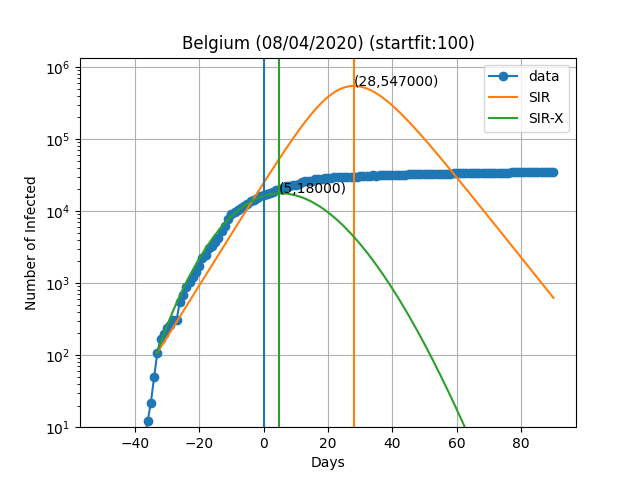
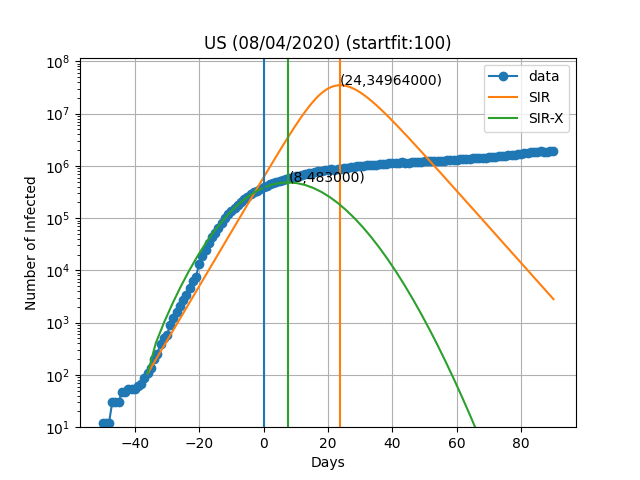
In April 2020 I fitted SIR and SIR-X models to reported active COVID-19 cases. The figures below reproduce the original fitting procedure using only the data available at the time; the blue data series is extended with the subsequent Johns Hopkins daily reports, through 7 July 2020, the end of the original 90-day plotting window.
Download the Python script used to generate these figures.
The blue points show the official number of active cases on each day, calculated in the same way as in the original post.
- Austria: the SIR-X fit captured the early peak and subsequent decline well.
- Italy: it captured the flattening, but underestimated and anticipated the peak (about 91,000 predicted versus 108,000 reported).
- Portugal, Spain, and Belgium: the fit captured the scale of the early plateau, but predicted a decline too soon.
- US: the fit failed beyond its short horizon: reported active cases continued to rise strongly after the predicted peak.
While the SIR-X model is not perfect, it is certainly much better than the SIR model.